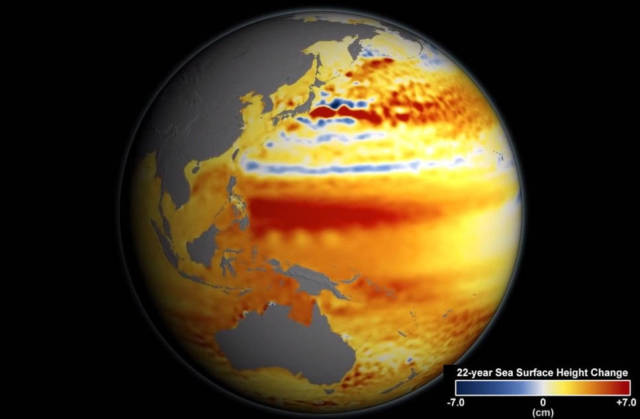
NASA satellites measured the planet‘s changing sea levels from 1992 to 2014. Since 1992, seas around the world have risen an average of nearly 3 inches. Watch the video…
In the blue regions on this map, the sea level has gone down, in orange and red regions it has gone up.
Video courtesy NASA’s Scientific Visualization Studio
Oceanographer Josh Willis from NASA’s Jet Propulsion Laboratory narrates this video about the causes of sea level rise and how sea level has changed over the last two decades as observed by the Jason series of satellite missions.
Seas around the world have risen an average of nearly 3 inches since 1992, with some locations rising more than 9 inches due to natural variation, according to the latest satellite measurements from NASA and its partners. An intensive research effort now underway, aided by NASA observations and analysis, points to an unavoidable rise of several feet in the future.
Members of NASA’s new interdisciplinary Sea Level Change Team will discuss recent findings and new agency research efforts during a media teleconference today at 12:30 p.m. EDT. NASA will stream the teleconference live online.
Greenland Ice Mass Loss: Jan. 2004 – June 2014:
The question scientists are grappling with is how quickly will seas rise?
Steve Nerem of the University of Colorado, Boulder, and lead of the Sea Level Change Team, said:
“Given what we know now about how the ocean expands as it warms and how ice sheets and glaciers are adding water to the seas, it’s pretty certain we are locked into at least 3 feet of sea level rise, and probably more. But we don’t know whether it will happen within a century or somewhat longer.”
source NASA


Leave A Comment