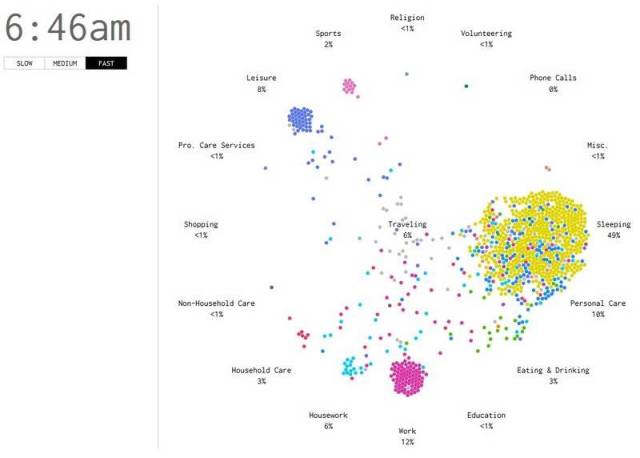
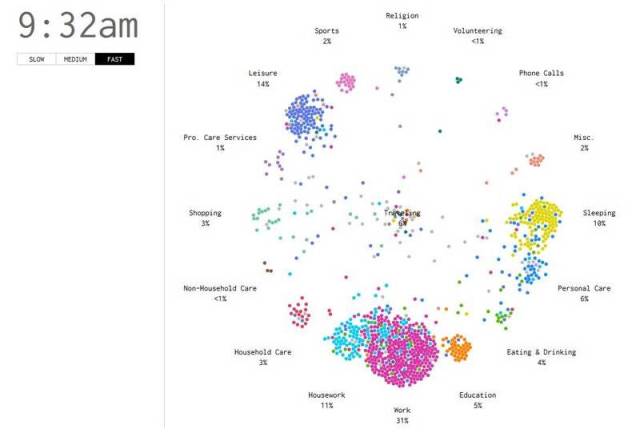
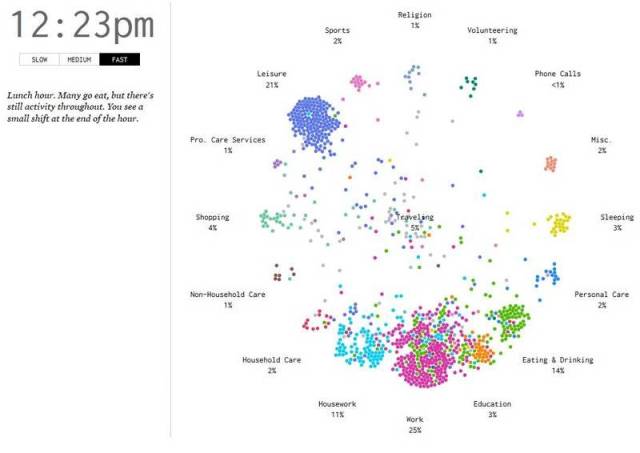
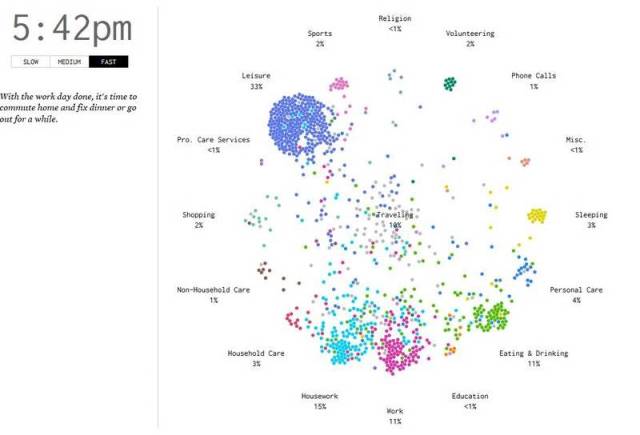
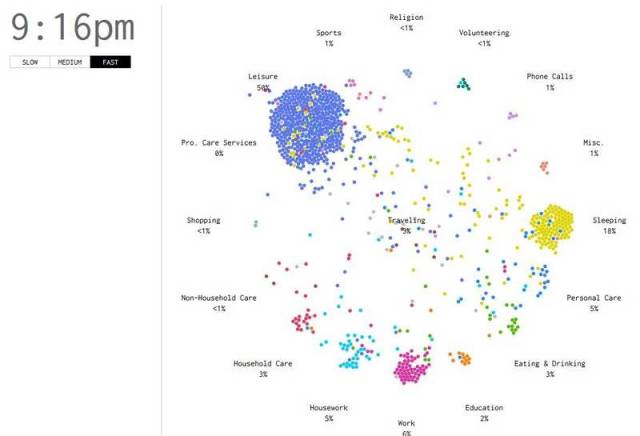
This exceptional visualization by statistician Nathan Yau shows how Americans spend a typical day.
This simulation from FlowingData, captures the flow of a thousand people’s average day by marking what are their activities at a specific period of time.
It’s based on data from the 2014 American Time Use Survey.
I can tell you that about 40 percent of people age 25 to 34 are working on an average day at three in the afternoon. I can tell you similar numbers for housework, leisure, travel, and other things. It’s an overview.
What I really want to see is closer to the individual and a more granular sense of how each person contributes to the patterns. I want to see how a person’s entire day plays out. (As someone who works from home, I’m always interested in what’s on the other side.)
Watch the visualization, here.
via gizmodo



Leave A Comment