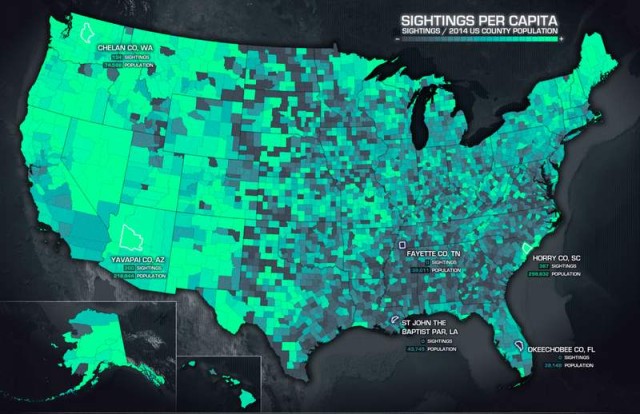
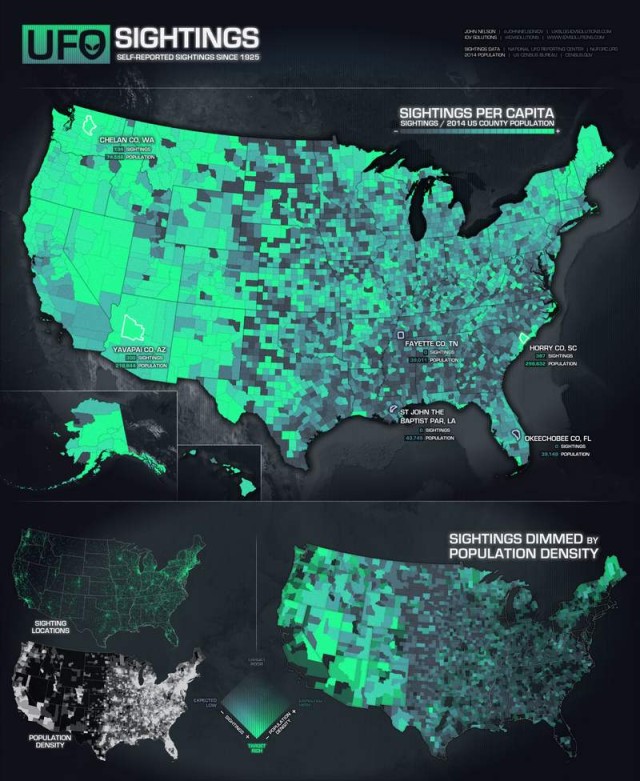
This UFO data visualization map made by expert John Nelson, combines census data with nearly 90 years of statistics.
Images credit John Nelson
The UFO data visualization map, compiled by the National UFO Reporting Center, shows where and when UFO sightings occur in the U.S., from 1925 to 2014.
John Nelson explains in his blog:
“As is the case for any observation data, there is a strong tendency towards echoing a population map. This is certainly the case with this sighting data, as well. In order to visualize the actual sighting phenomenon, I needed to normalize by the underlying population. The first, more prominent map shows a simple ratio of the sightings by population. A per-capita approach.”
via io9
source idvsolutions




Leave A Comment