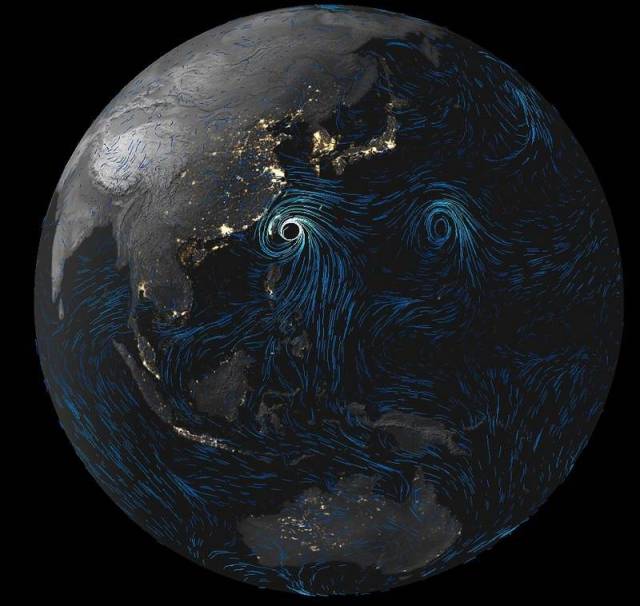
You can now watch global weather in real-time, in a new impressive interactive map by NOAA.
WeatherView by NOAA, the map allows you to also see winds, temperature, moisture, precipitation and pressure. The above image shows Typhoon Soudelor, which has hit Taiwan.
You can zoom-in, zoom-out, drag the globe to a location and to find out the wind patterns and more.
Se the interactive map at NOAA.
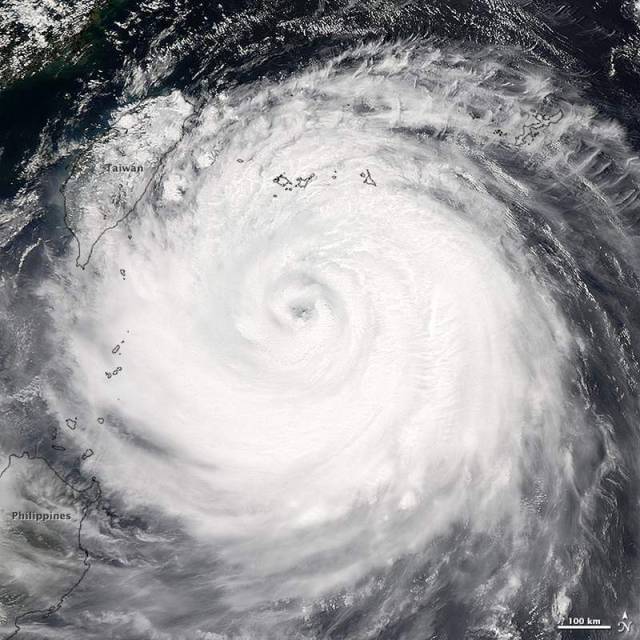
After a period of rapid intensification on August 1, Typhoon Soudelor became the sixth category 5 storm of 2015. While the typhoon weakened during the ensuing days, it was poised to make landfall in central Taiwan on August 8 as a category 3 storm. Forecasters expect much of the northern half of Taiwan to face sustained winds of 160 kilometers (100 miles) per hour. Rainfall totals in some areas could approach 1 meter (3 feet), which has raised concerns about dangerous flooding and mudslides.
At 04:40 UTC (12:40 p.m. local time) on August 7, 2015, the Moderate Resolution Imaging Spectroradiometer (MODIS) on NASA’s Aqua satellite acquired this image of the storm approaching Taiwan. This island is no stranger to tropical cyclones, as an average of 3.5 typhoons make landfall or cause significant damage there each year, noted meteorologist Bob Henson. In 2009, slow-moving Typhoon Morakot caused 450 deaths and billions of dollars of damage.
source earthobservatory


Leave A Comment