A global digital map of seafloor, will help scientists to better understand and predict climate change.
Images credit University of Sydney’s School of Geosciences
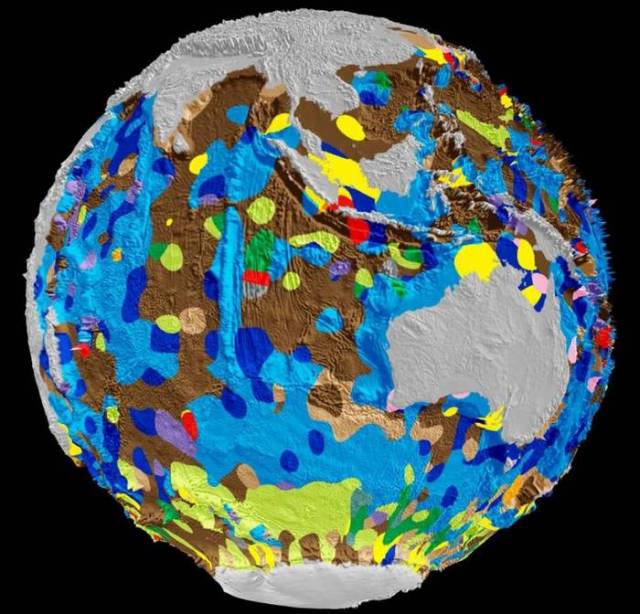
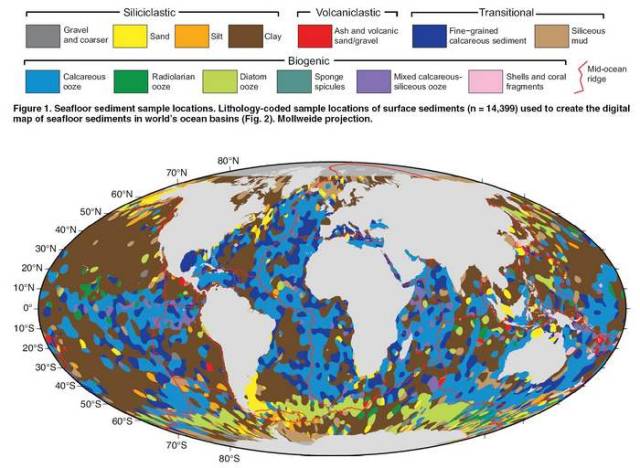
According to a study published in Geology, scientists from the University of Sydney’s School of Geosciences, created a new comprehensive digital map of our seafloor, covering 70 percent of the planet’s surface.
The interactive map will help scientists to better understand the ocean floor, and to predict how the ocean’s environment will interact to climate change.
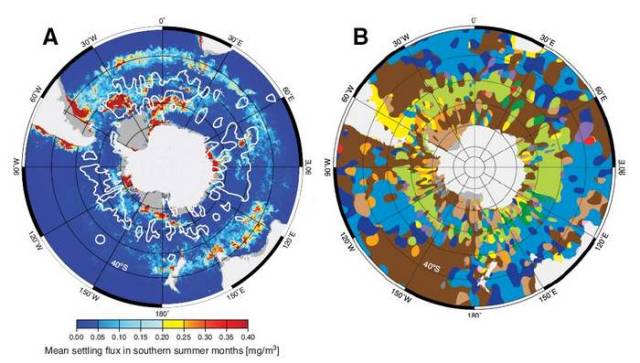
We present the first digital map of seafloor lithologies based on descriptions of nearly 14,500 samples from original cruise reports, interpolated using a support vector machine algorithm. We show that sediment distribution is more complex, with significant deviations from earlier hand-drawn maps, and that major lithologies occur in drastically different proportions globally. By coupling our digital map to oceanographic data sets, we find that the global occurrence of biogenic oozes is strongly linked to specific ranges in seasurface parameters. In particular, by using recent computations of diatom distributions from pigment-calibrated chlorophyll-a satellite data, we show that, contrary to a widely held view, diatom oozes are not a reliable proxy for surface productivity. Quantifying the link between the seafloor and the sea surface through the use of large digital data sets will ultimately lead to more robust reconstructions and predictions of climate change and its impact on the ocean environment.
via Popsci
source gplates.org



Leave A Comment