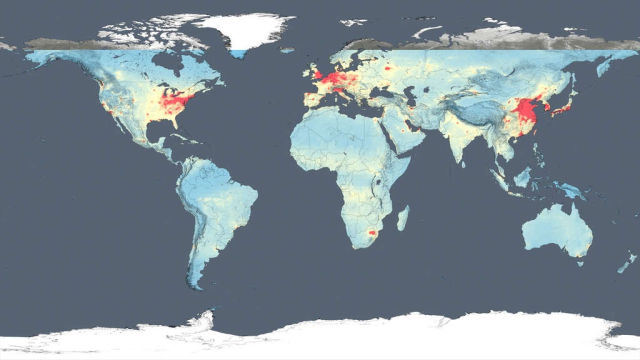
NASA’s global air quality map show human fingerprint on global air quality and that we have the power to reduce pollution. Watch the results at the video…
The results on these maps shows clearly that the United States, Europe and Japan have improved air quality thanks to emission control regulations, while China, India and the Middle East, with their fast-growing economies and expanding industry, have seen more air pollution.
Scientists from NASA tracked air pollution trends over the last decade in various regions and 195 cities around the globe, using new, high-resolution global satellite maps of air quality indicators.
Scientist Bryan Duncan and his team examined observations made from 2005 to 2014 by the Ozone Monitoring Instrument aboard NASA’s Aura satellite. One of the atmospheric gases the instrument detects is nitrogen dioxide, a yellow-brown gas that is a common emission from cars, power plants and industrial activity. Nitrogen dioxide can quickly transform into ground-level ozone, a major respiratory pollutant in urban smog. Nitrogen dioxide hotspots, used as an indicator of general air quality, occur over most major cities in developed and developing nations.
source NASA


Leave A Comment