NASA’s ECOsystem Spaceborne Thermal Radiometer Experiment on Space Station (ECOSTRESS) captured new imagery of variations in surface-temperature patterns in Los Angeles County.
The first of its kind to be taken by one of the agency’s newest Earth-observing mission, it is more detailed than previous imagery and, unlike prior imagery, was acquired at different times of the day.
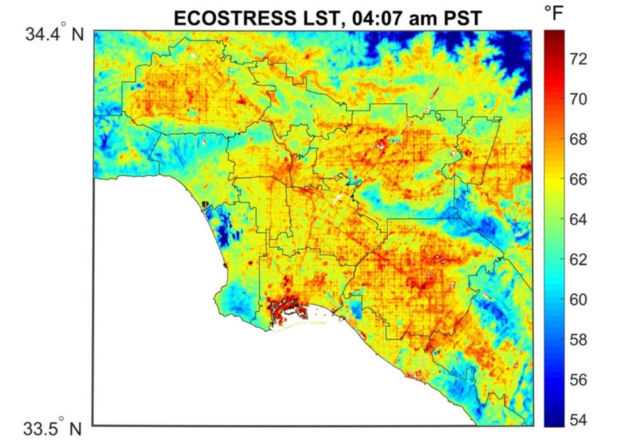
Above, ECOSTRESS captured surface temperature variations in Los Angeles, CA in the early morning hours of July 22. Hot areas are shown in red, warm areas in orange and yellow, and cooler areas in blue. Credit: NASA/JPL-Caltech
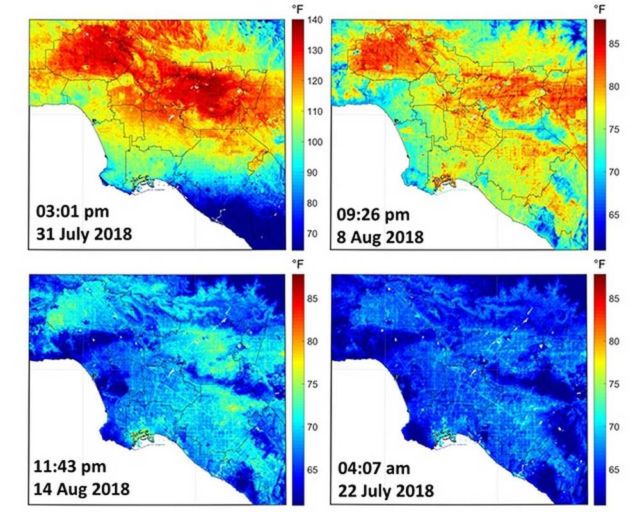
ECOSTRESS measures surface temperature — the temperature you would feel if you touched the surface of something — rather than the air temperature typically reported by weather stations. The images were acquired throughout the day between July 22 and Aug. 14 during an extended period of high temperatures in the Los Angeles area.
Cooler temperatures appear in blue, and warmer temperatures are shown in red. In the image taken July 22 at 4:07 a.m., the hottest (reddest) areas are dark asphalt surfaces that are unshaded during the day and remain warm throughout the night. They include freeways, airports, oil refineries and parking lots. The cool (blue) areas are clouds and higher-elevation mountainous regions (dark blue).
ECOSTRESS imagery shows surface temperature variations in Los Angeles, California between July 22 and August 14 at different times of day. Hot areas are shown in red, warm areas in orange and yellow, and cooler areas in blue. Image credit: NASA/JPL-Caltech
source JPL


Leave A Comment