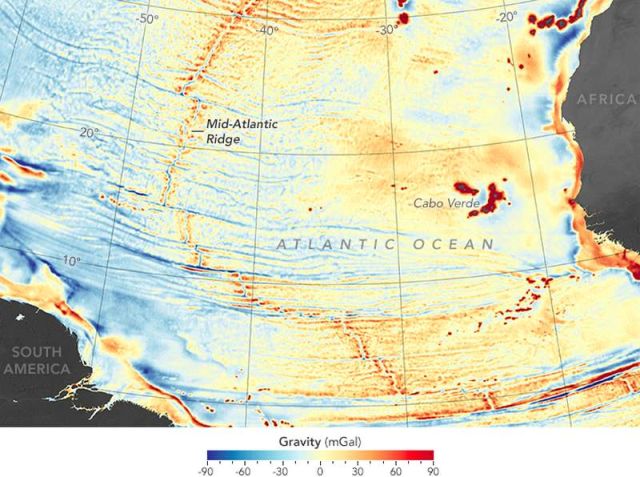
The map above shows a global view of gravity anomalies, unveiling the most complete unified view of the Earth’s seafloor to date.
It has been said that we have more complete maps of the surface of Mars or the Moon than we do of Earth. Close to 70 percent of our planet is covered by water, and that water refracts, absorbs, and reflects light so well that it can only penetrate a few tens to hundreds of meters. To humans and most satellite eyes, the deep ocean is opaque.
But there are ways to visualize what the planet looks like beneath that watery shroud. Sonar-based (sounding) instruments mounted on ships can distinguish the shape (bathymetry) of the seafloor. But such maps can only be made for places where ships and sonar pass frequently. The majority of such measurements have been made along the major shipping routes of the world, interspersed with results from scientific expeditions over the past two centuries. About 5 to 15 percent of the global ocean floor has been mapped in this way, depending on how you define “mapped.”
There is another way to see the depths of the ocean: by measuring the shape and gravity field of Earth, a discipline known as geodesy. David Sandwell of the Scripps Institution of Oceanography and Walter Smith of the National Oceanic and Atmospheric Administration have spent much of the past 25 years negotiating with military agencies and satellite operators to allow them acquire or gain access to measurements of the Earth’s gravity field and sea surface heights. The result of their collaborative efforts is a global data set that tells where the ridges and valleys are by showing where the planet’s gravity field varies.
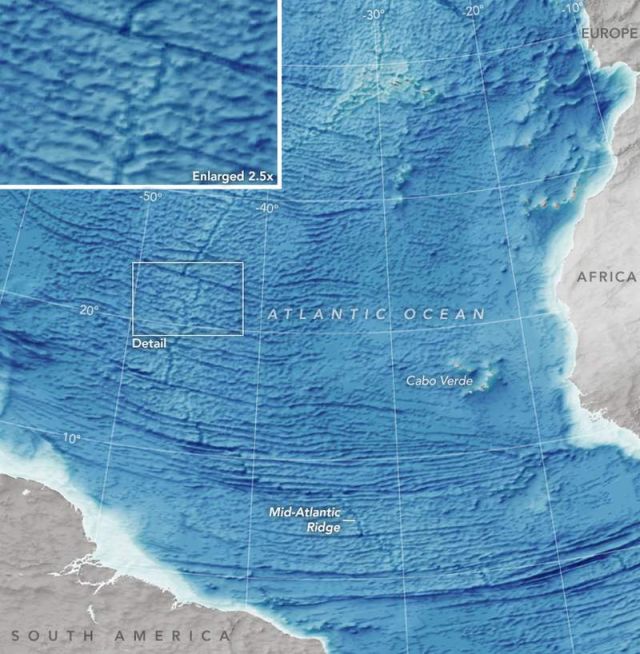
In the map above, as measured and assembled by Sandwell, Smith, and colleagues, shades of orange and red represent areas where seafloor gravity is stronger (in milligals) than the global average, a phenomenon that mostly coincides with the location of underwater ridges, seamounts, and the edges of Earth’s tectonic plates. Shades of blue represent areas of lower gravity, corresponding largely with the deepest troughs in the ocean. The second map shows a tighter view of that data along the Mid-Atlantic Ridge between Africa and South America.
source earthobservatory


Leave A Comment