

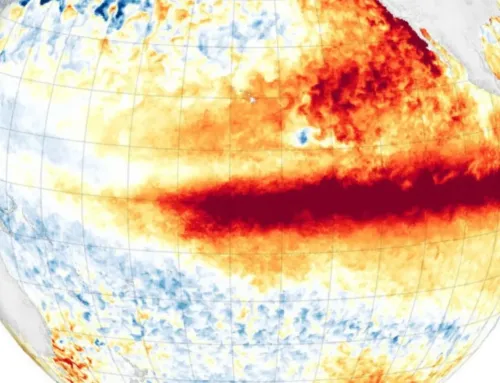
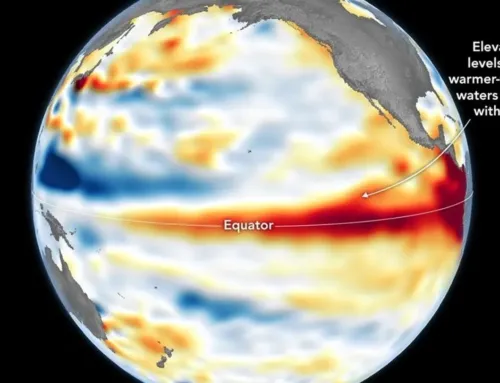
This visualization shows a heavy rainfall throughout Northern Texas and across Oklahoma as well as the drought in Southern California, by NASA’s Global Precipitation Measurement (GPM) mission. Watch the timelapse…

The accumulated precipitation product visualized here begins on Jan. 1, 2015, and runs through July 16, 2015.
NASA’s Global Precipitation Measurement (GPM) mission launched on Feb. 27, 2014. It is a collaboration between NASA and the Japan Aerospace Exploration Agency and acts as the standard to unify precipitation measurements from a network of 12 satellites. The result is NASA’s Integrated Multi-satellitE Retrievals for GPM data product, called IMERG, which combines data from all 12 satellites into a single, seamless map. The map covers more of the globe than any previous precipitation data set, allowing scientists to see how rain and snow storms move around nearly the entire planet. As scientists work to understand all the elements of Earth’s climate and weather systems, and how they could change in the future, GPM provides a major step forward in providing the scientific community comprehensive and consistent measurements of precipitation.
Credit: NASA Goddard’s Scientific Visualization Studio
source NASA.org

Leave A Comment