

A comprehensive infographic starts back 20,000 years, to show just how drastically Earth is warming in our days.
The amazing comic illustrations of the latest XKCD Earth’s Temperature Timeline, starts from 20,000 BCE to 2016.
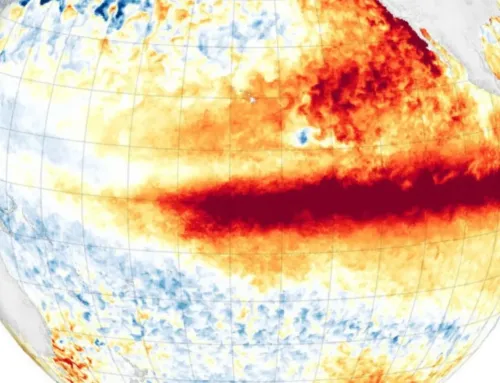
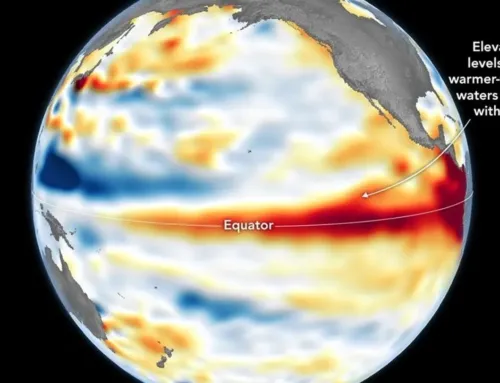
The temperature change during the last years doesn’t look good.

source XKCD

Leave A Comment